Sodium carbonate (Na2CO3, soda ash) raises the pH of culture water over all typical aquaculture conditions.
That's unlike sodium bicarbonate (NaHCO3, baking soda), which, depending on culture conditions, either raises, lowers, or does not change pH much at all.
Both compounds always raise alkalinity.
Soda ash is more efficient than bicarb for raising pH. In most cases, that makes it the more cost-effective choice for pH control (and for avoiding excessive alkalinity).
Like any reagent, however, sodium carbonate is of limited value for precision water-quality management when used alone. Precision control requires that it be combined with at least one other reagent.
Table of Contents
Plain Language Summary
It takes a much smaller amount of sodium carbonate (Na2CO3, soda ash) to raise pH than bicarb (NaHCO3, baking soda).
In some cases, you need only about one-tenth as much.
And unlike bicarb, it raises pH over all culture conditions.
So, even when soda ash costs more, it's more cost-effective.
Each unit of soda ash dissolved in culture water adds two units of [Alk] and one unit of inorganic carbon.
The effect on pH is hard to explain in words & equations. This post makes it clear by matching slopes on the WQ Map.
Soda ash can be used alone, but it must be combined with at least one other compound for precise pH control.
The Key Take-away
Sodium carbonate (soda ash) always raises pH more cost-effectively than sodium bicarbonate (baking soda).
Quick Background
Deposits of sodium carbonate (Na2CO3, soda ash, or washing soda) occur naturally, but most commercial soda ash is produced chemically via the Solvay process.
Outside of aquaculture, Na2CO3 is used as a water softener to remove calcium and magnesium. Other uses include production of soap, detergents, and glass, and in preparing certain dyes.
Sodium carbonate also is used to adjust the pH of foods (e.g. certain cheeses) and beverages, and that brings us to its application in aquaculture.
pH control is key to aquaculture water-quality management.
Respiration of aquatic animals, plants, and microorganisms increases dissolved CO2, and higher CO2 means lower pH.
Many aquaculturists rely on sodium bicarbonate (NaHCO3, baking soda, or just “bicarb”) to raise pH.
But we saw in another post that bicarb alone does not raise pH efficiently within the pH range of most culture systems.
Depending on its grade (purity), packaging, and availability, sodium carbonate can be more expensive than sodium bicarbonate, but its potency always makes it more cost-effective than bicarb for pH control.
We'll illustrate sodium carbonate's effect on pH with a few simple visualizations from the Water Quality Map.
Visualizing aquaculture water quality
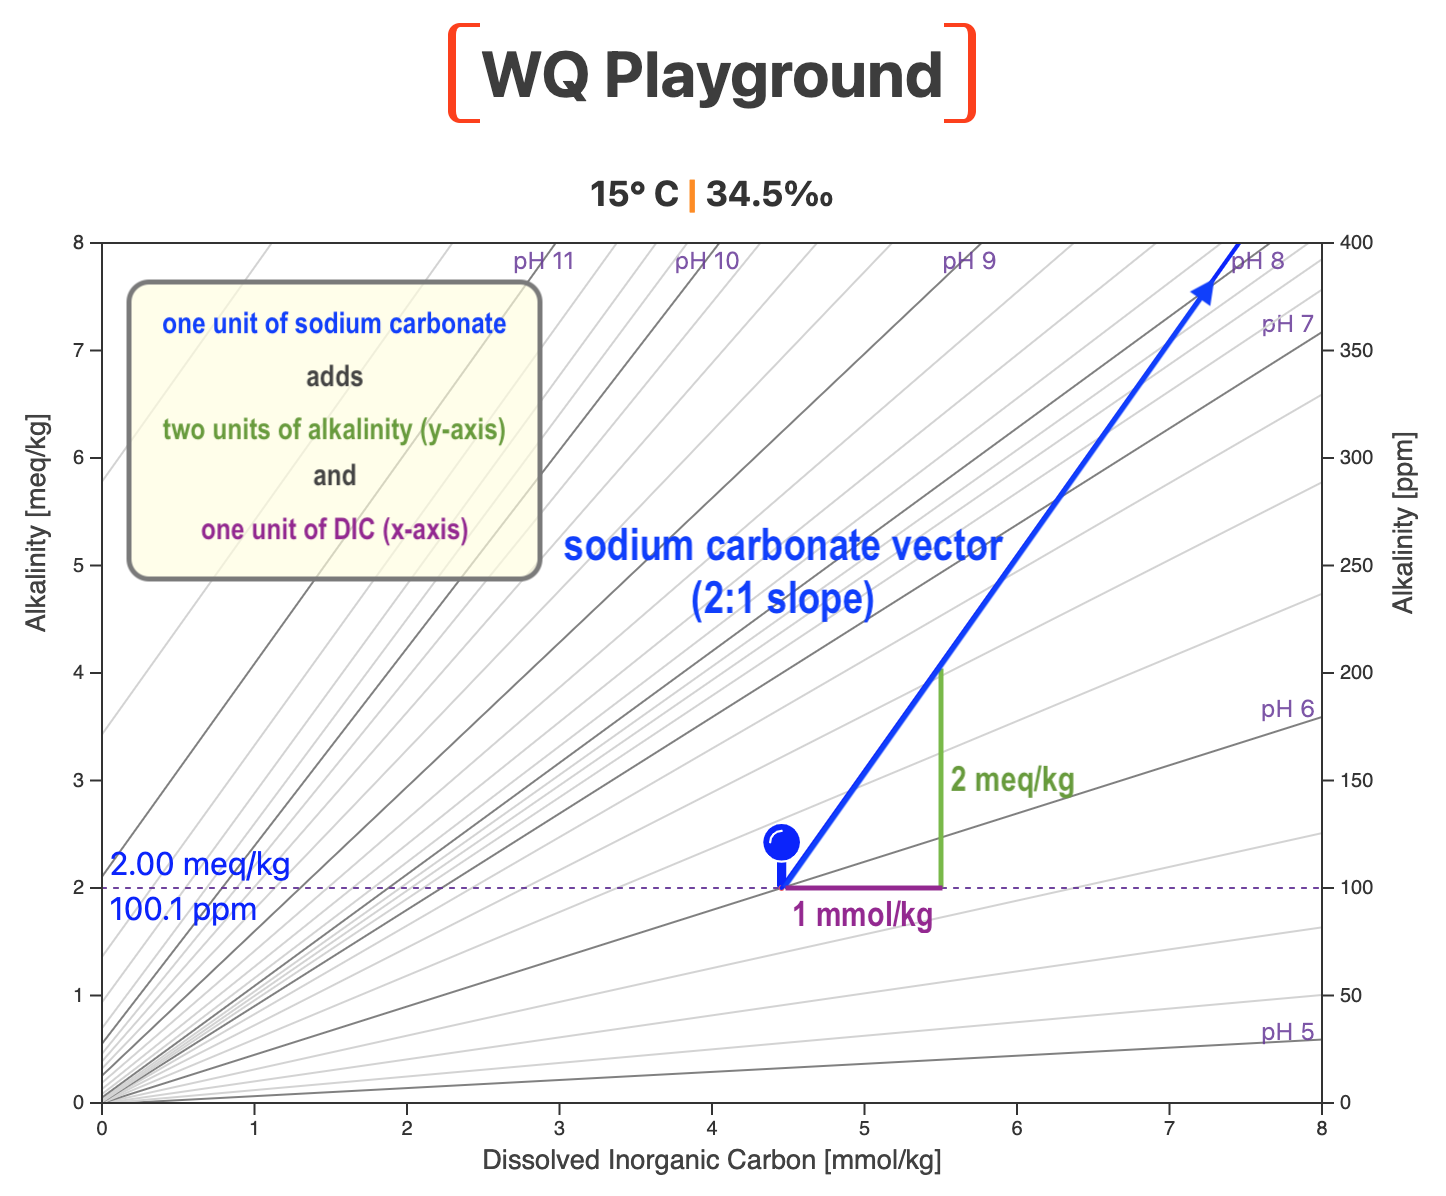
The Water Quality Map is a topographic map of pH, as pictured below for 15° C (59° F) and 34.5‰.
Oceanographers know this as a Deffeyes Diagram. To serve our purposes, I've adapted it for aquaculture and aquaponics.
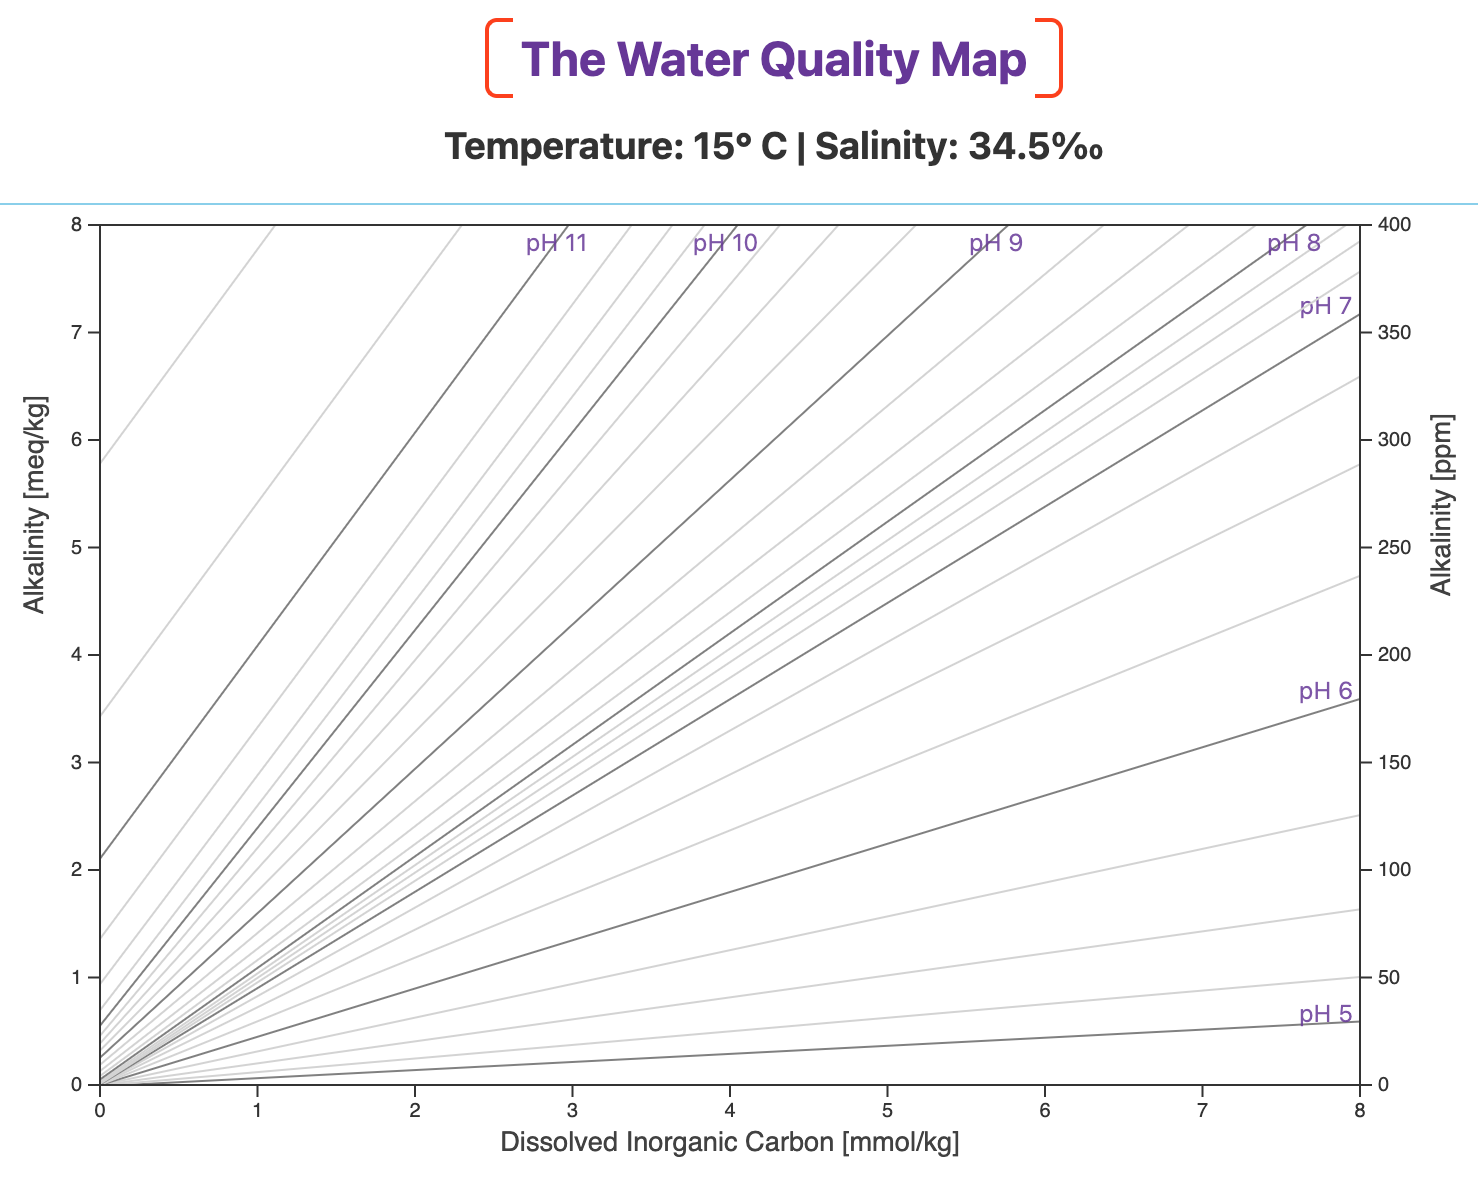
Alkalinity is on the two y-axes and Dissolved Inorganic Carbon (DIC) — the total concentration of bicarbonate ion, carbonate ion, and dissolved carbon dioxide — is on the x-axis.
Lines of equal pH are projected onto the map, just like lines of equal elevation on a topographic map.
Lower pH values have shallower slopes and are found toward the right of the map.
Higher pH values have steeper slopes and are on the left.
The slopes of the pH lines and the relative spacing among them depend on your culture environment's temperature and salinity.
If you're not familiar with this visual approach to aquaculture WQ management, you'll find a short interactive "scrollytelling" introduction at the WQ Viz website.
Our example system:
- 100 m3 (~26,417 gallon US)
- 15° C (59° F)
- 34.5‰ (42.37 mS/cm conductivity)
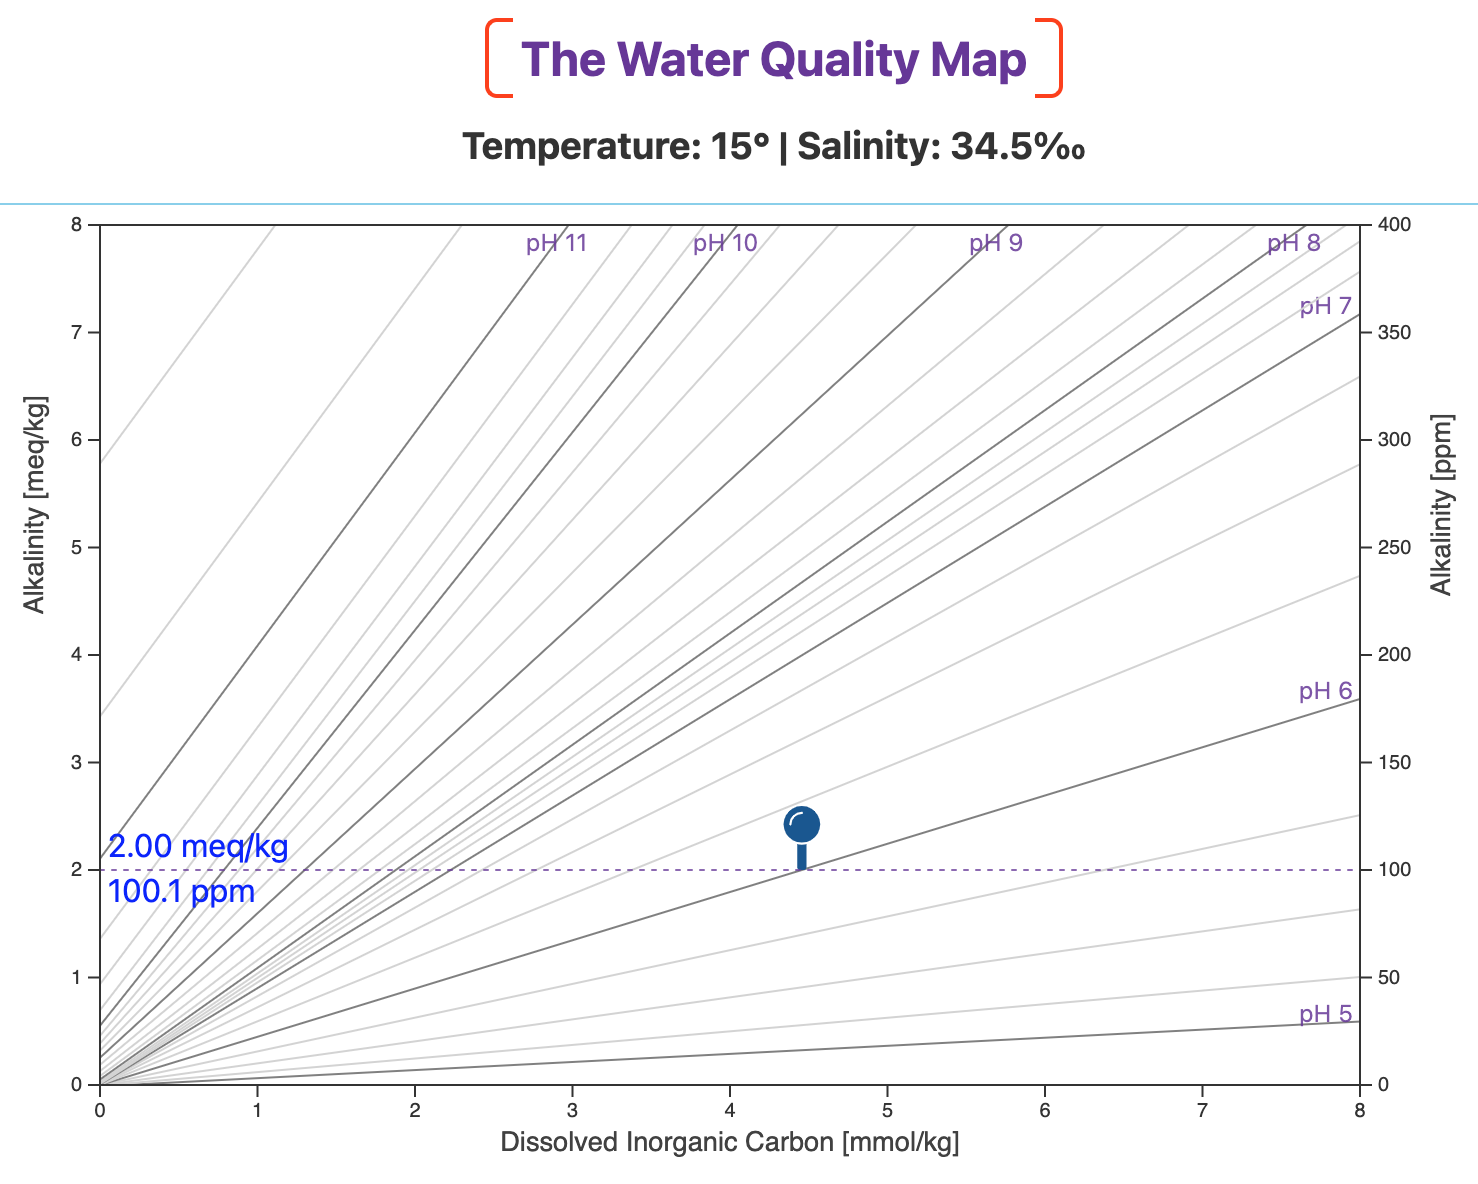
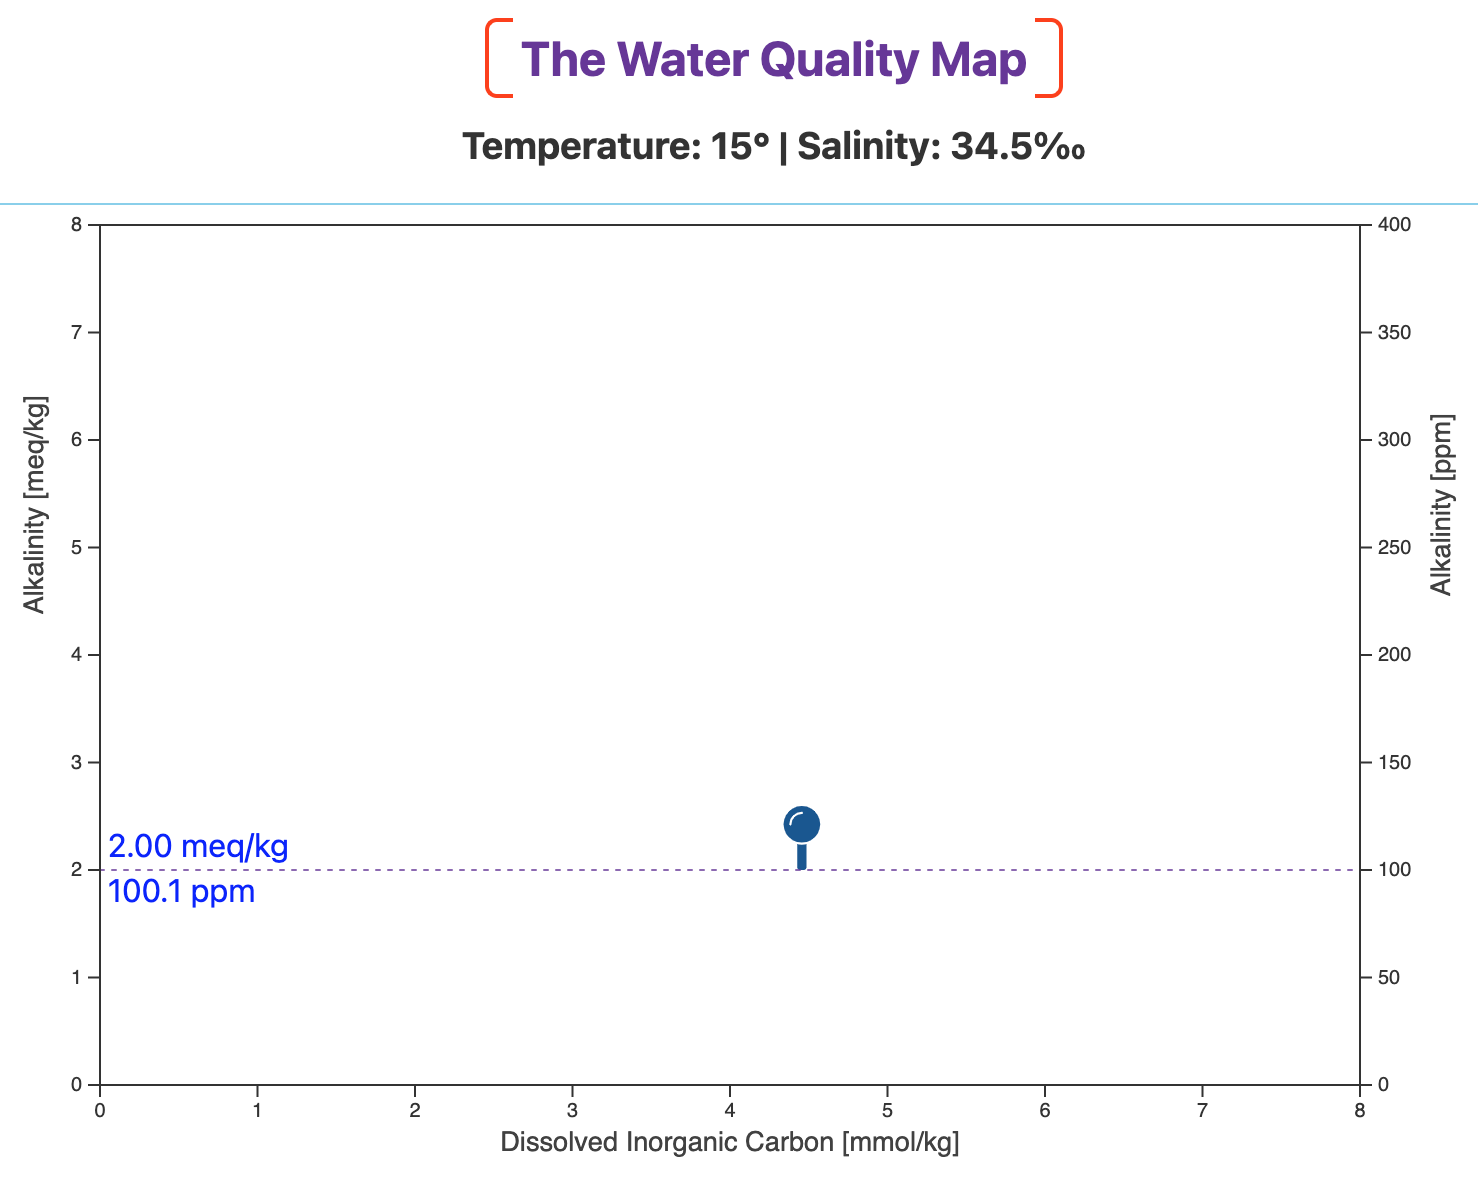
Before adding sodium carbonate, our water is at pH 6.0 and alkalinity is 2.0 meq/kg (~100 ppm as CaCO3).
The blue pin marks that initial waypoint on the map (below).
[OPTIONAL] An optical illusion
The Carbonate Vector
When you dissolve one unit of sodium carbonate (Na2CO3) in culture water it dissociates into two positively-charged sodium ions (Na+) and a negatively-charged carbonate ion (CO3=):
How does that change our water quality?
Carbonate adds inorganic carbon
The carbonate ion carries a carbon atom (the C in CO3=). Adding one unit of the carbonate ion thus increases DIC by one unit.
That added DIC moves us one unit to the right on the Water Quality Map, parallel to the x-axis.
Carbonate also adds alkalinity
The carbonate ion also carries two negative charges (CO3=). That adds two units of alkalinity to the culture water.
That moves us two units up, parallel to the y-axis.
[OPTIONAL] What about the Na+?
Now let's use that information to see how adding soda ash plots on the Water Quality Map.
In the next map, we again start at , our initial waypoint.
We take one step to the right, parallel to the DIC axis. That represents adding one unit of DIC (1 mmol/kg).
And we take two steps up, parallel to the alkalinity axis. That represents adding two units of alkalinity (2 meq/kg).
The result? We end up at a point on the blue carbonate vector.
If we added 3.5 units of soda ash, we'd take 3.5 steps to the right and 2 x 3.5 = 7 steps up.
That puts us at a different point on the same blue carbonate line.
So, we plot soda ash additions as a vector with a slope of 2 (i.e., ~63.4° angle) directed toward the upper right of the map.
If you read the post on sodium bicarbonate, you'll remember that adding bicarb plots as a vector with a slope of 1 (i.e. a 45° angle).
We now have everything we need to visualize the effect of adding sodium carbonate on our culture water's pH.
All we'll have to do is compare the slope of the carbonate vector with the slopes of the nearby pH lines.
(Two links at the bottom of this page take you to interactive versions of the Water Quality Map so that you can play with the explanations in this post.)
Sodium carbonate raises pH
We'll again start at pH 6.0, the red pin in the next map.
This is a lower pH than is typical for aquaculture, but it serves here to illustrate our general point.
The screenshot below shows the result of adding 4.7 kg (10.3 lbs) of sodium carbonate to our 100-m3 system.
Under our conditions, 4.7 kg of soda ash raises pH from 6.0 to 6.25.
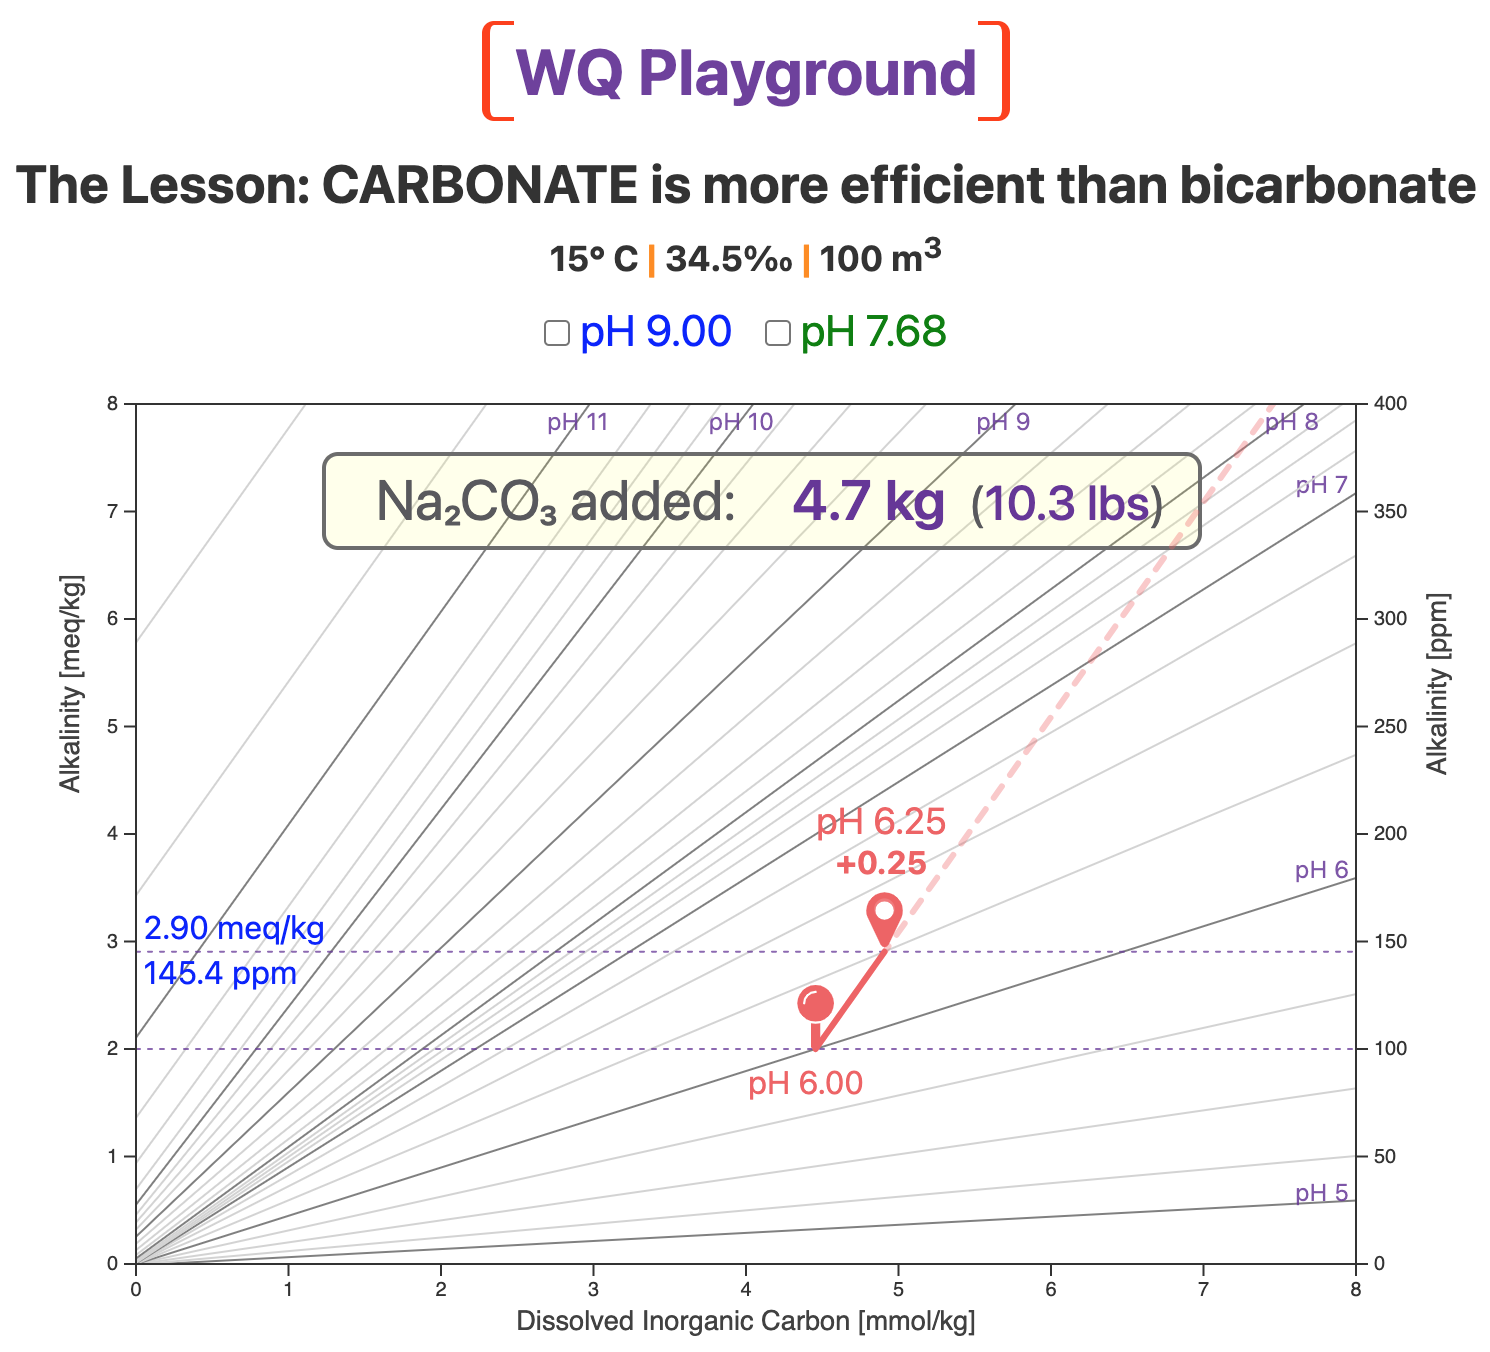
Now compare the slope of the red carbonate vector with the slopes of the nearby pH lines.
Note that the slope of the carbonate vector is much steeper than the slopes of the pH 6.0 and pH 7.0 lines.
Because the carbonate slope is steeper, it cuts across lines of higher and higher pH.
The practical result is what most aquaculturists expect: Adding sodium carbonate increases pH.
That's unlike sodium bicarbonate, which doesn't always raise pH and even can lower it.
Sodium carbonate, however, always raises pH under the conditions of typical aquaculture production systems.
(Soda ash's ability to raise pH diminishes as initial pH increases, but, depending on temperature & salinity, the starting pH would have to be above ~10.5 before soda ash would not have a measureable effect on pH.)
Sodium carbonate vs. sodium bicarbonate
A direct comparison will drive home the difference in using sodium carbonate or sodium bicarbonate to control pH.
We'll illustrate this in two ways by showing:
-
the amount of each compound needed to reach the same pH
-
the pH that results from the same amount of each compound
In both cases, our starting point will be pH 6.90 and an alkalinity of 2.0 meq/kg (~100 ppm).
1. What amount gets us from pH 6.90 to pH 7.15?
The next screenshot shows the amount of each reagent needed to raise pH 6.90 by 0.25 pH units at 15° C (59° F) and 34.5‰.
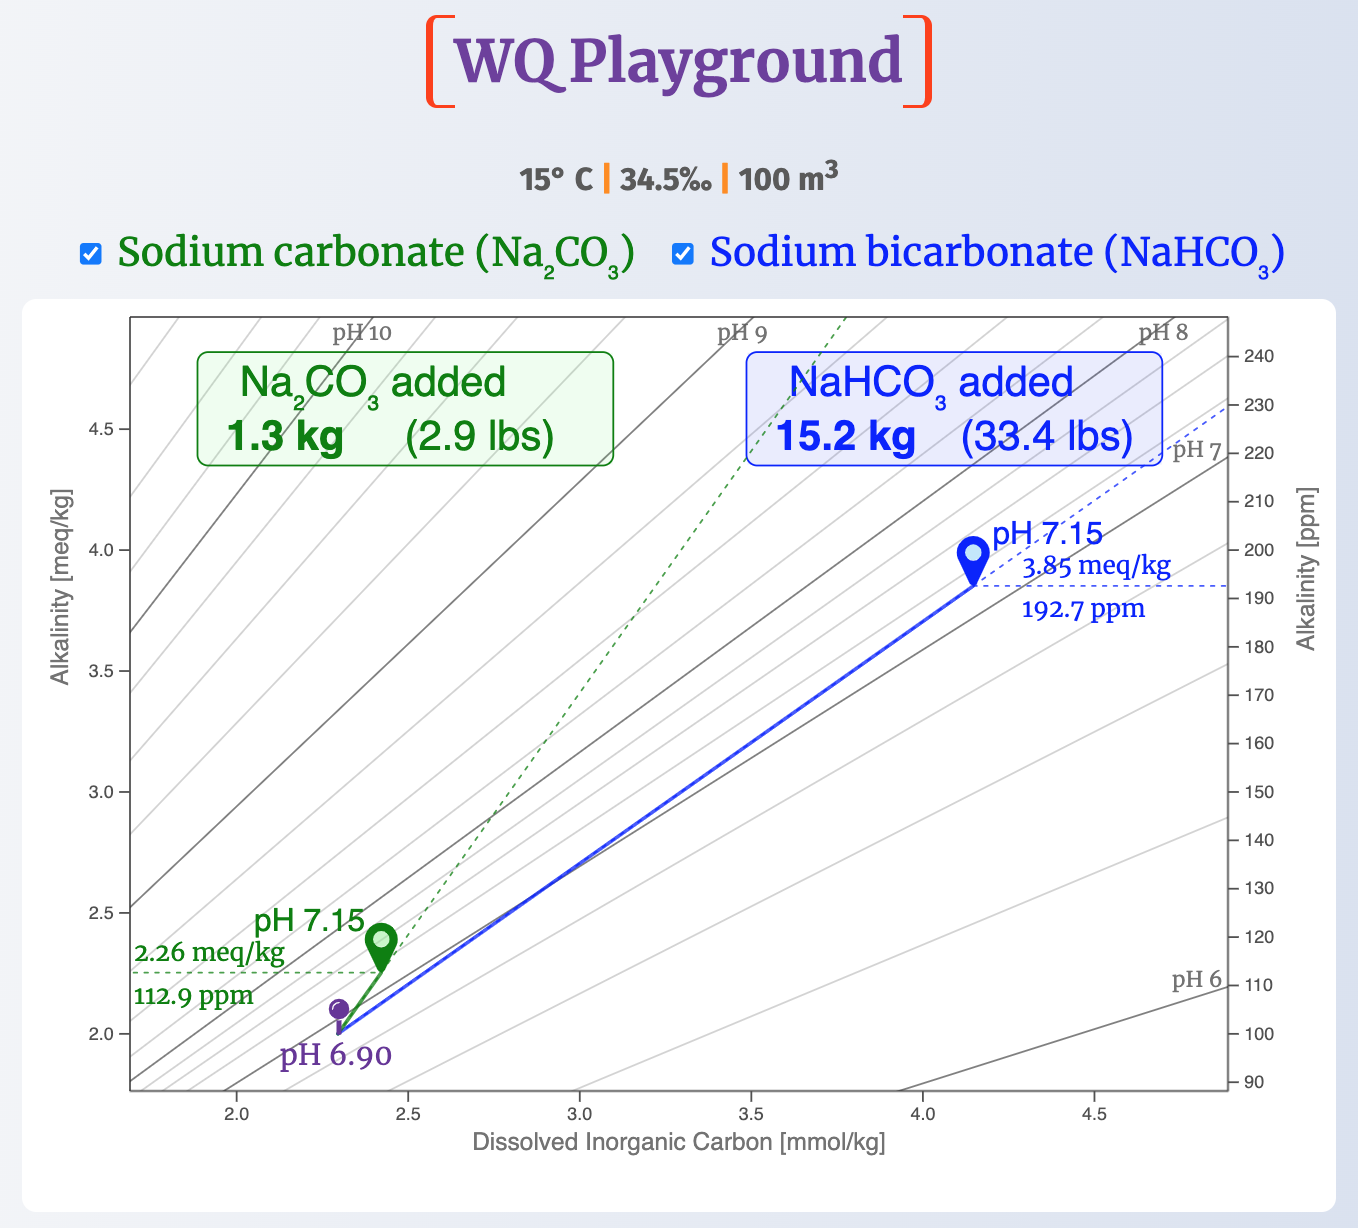
For sodium carbonate, it takes about 1.3 kg (2.9 lbs) to raise pH from 6.90 to the pH 7.15 target .
But it takes more than ten times as much sodium bicarbonate (15.2 kg, or 33.4 lbs) to reach the same pH target .
It always takes less sodium carbonate than sodium bicarbonate to raise pH, but the difference depends on temperature, salinity, starting pH, & starting alkalinity.
That's a lot of bicarb to add for a pretty small pH change. As you can imagine, that's not very economical.
Adding bicarb also comes with a significant increase in alkalinity.
Here, bicarb added about seven times as much alkalinity (1.85 meq/kg, or ~93 ppm) as soda ash (0.26 meq/kg, or ~13 ppm).
Excessive alkalinity is a problem that is often overlooked in aquaculture. It's a topic for another post.
2. How high does 5 kg of each compound raise pH?
The next map shows how high 5 kg (11 lbs) of sodium carbonate and sodium bicarbonate each raise pH, again starting at pH 6.90.
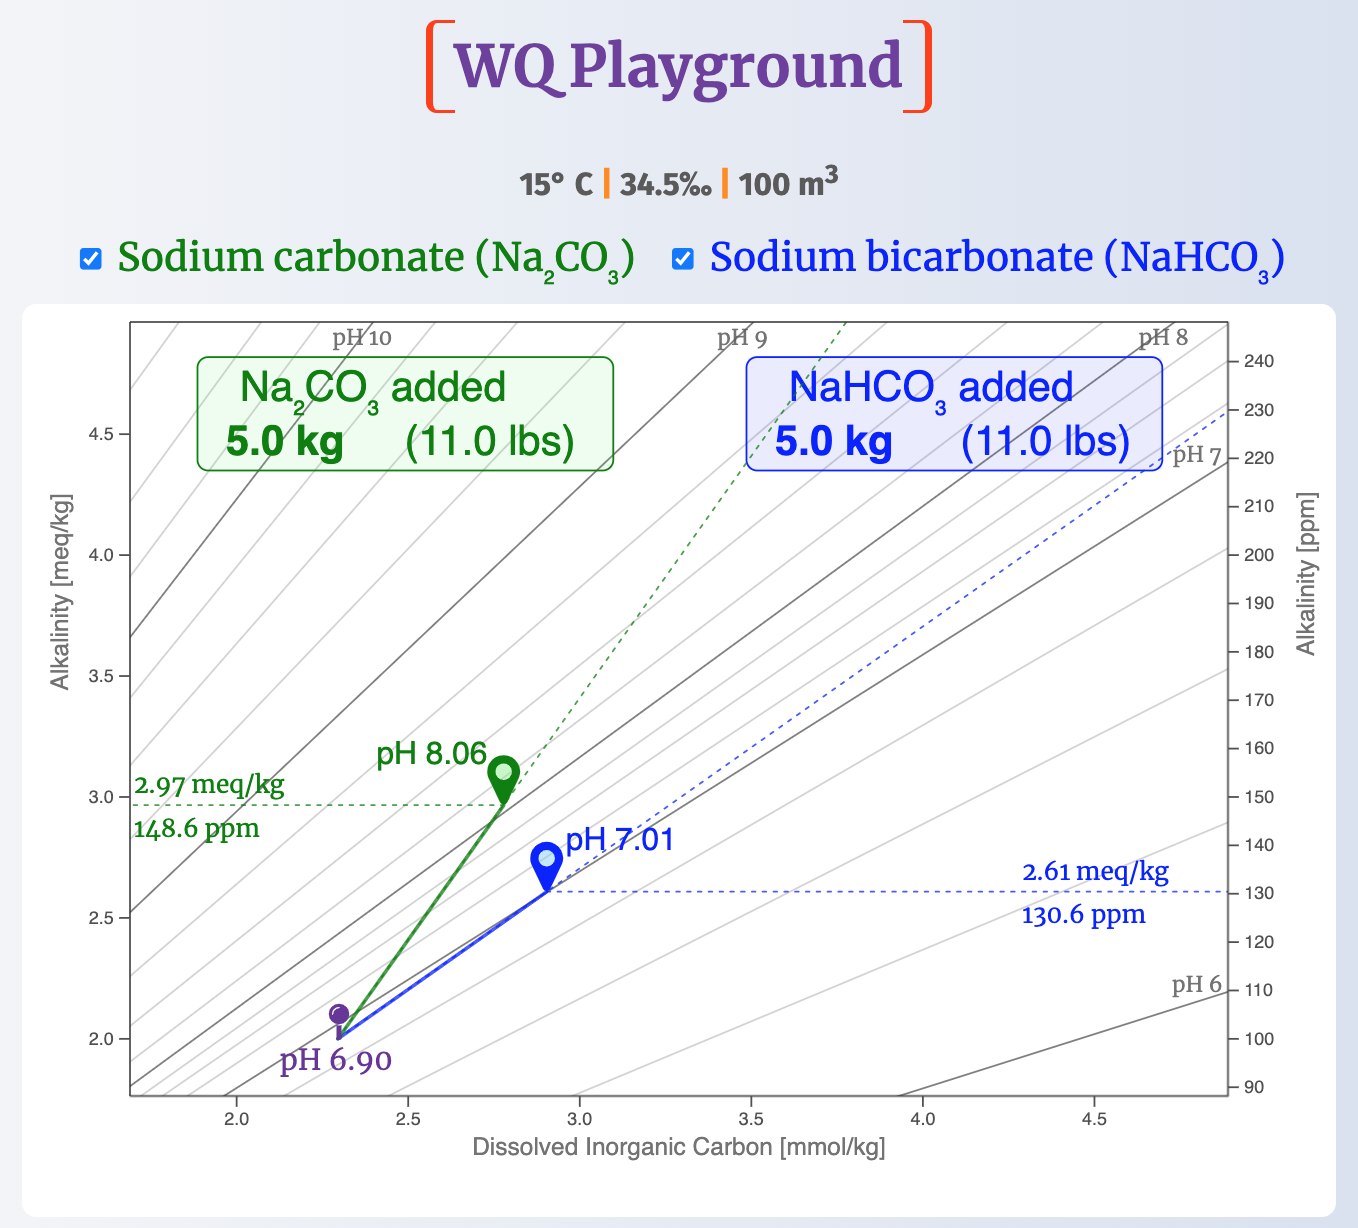
The difference is dramatic.
Under these conditions, 5 kg of bicarb raise pH to only 7.01, little more than one-tenth of a pH unit; but the same amount of sodium carbonate raises pH by 1.16 pH units to 8.06.
As explained in the post on bicarbonate, such situations have led some aquaculturists who add massive amounts of bicarb but see very little change in pH to think that their pH meter might be broken. Instead, it's just the chemistry of bicarbonate at work.
Finally, it's worth noting that both reagents always increase alkalinity, as they did in this case.
Sodium carbonate wrap-up
Sodium carbonate...
-
...always increases pH under typical culture conditions
-
...is more efficient than sodium bicarbonate for raising pH
-
...is more cost-effective than bicarb, even when more expensive
-
...always increases alkalinity, which can lead to high-alk problems
-
...adds sodium ion, which upsets the natural Na:K ratio
Just like sodium bicarbonate and other adjustment compounds, sodium carbonate must be used with at least one other reagent for precise water-quality control.
Which other reagent(s)?
pH-alkalinity adjustment options include sodium bicarbonate (NaHCO3, baking soda), sodium hydroxide (NaOH, caustic soda), calcium hydroxide (Ca(OH)2, slaked lime), and others reagents.
The way in which various combinations of reagents influence the state of your culture water will be discussed in other posts.